Content Logs
The logs viewer contains execution details for each launched process associated with the piece of content. Standard output and standard error are captured and streaming log entries appear in real time.
The logs viewer can be opened from the Connect dashboard Toolbar menu by clicking the Show Logs icon. For smaller windows and mobile, this icon is consolidated into the More option. The logs can also be opened and closed with a keyboard shortcut (~).
Search and download functionality is scoped to the log file you currently have selected and displayed in the logs viewer.
Switching between logs
Use the Logs Selection drop-down (located in the upper left) to view the available logs and switch between them in the viewer. Logs are organized by content bundle. Each time you publish an update to a content item, a new content bundle is created. The current bundle is denoted as Active.
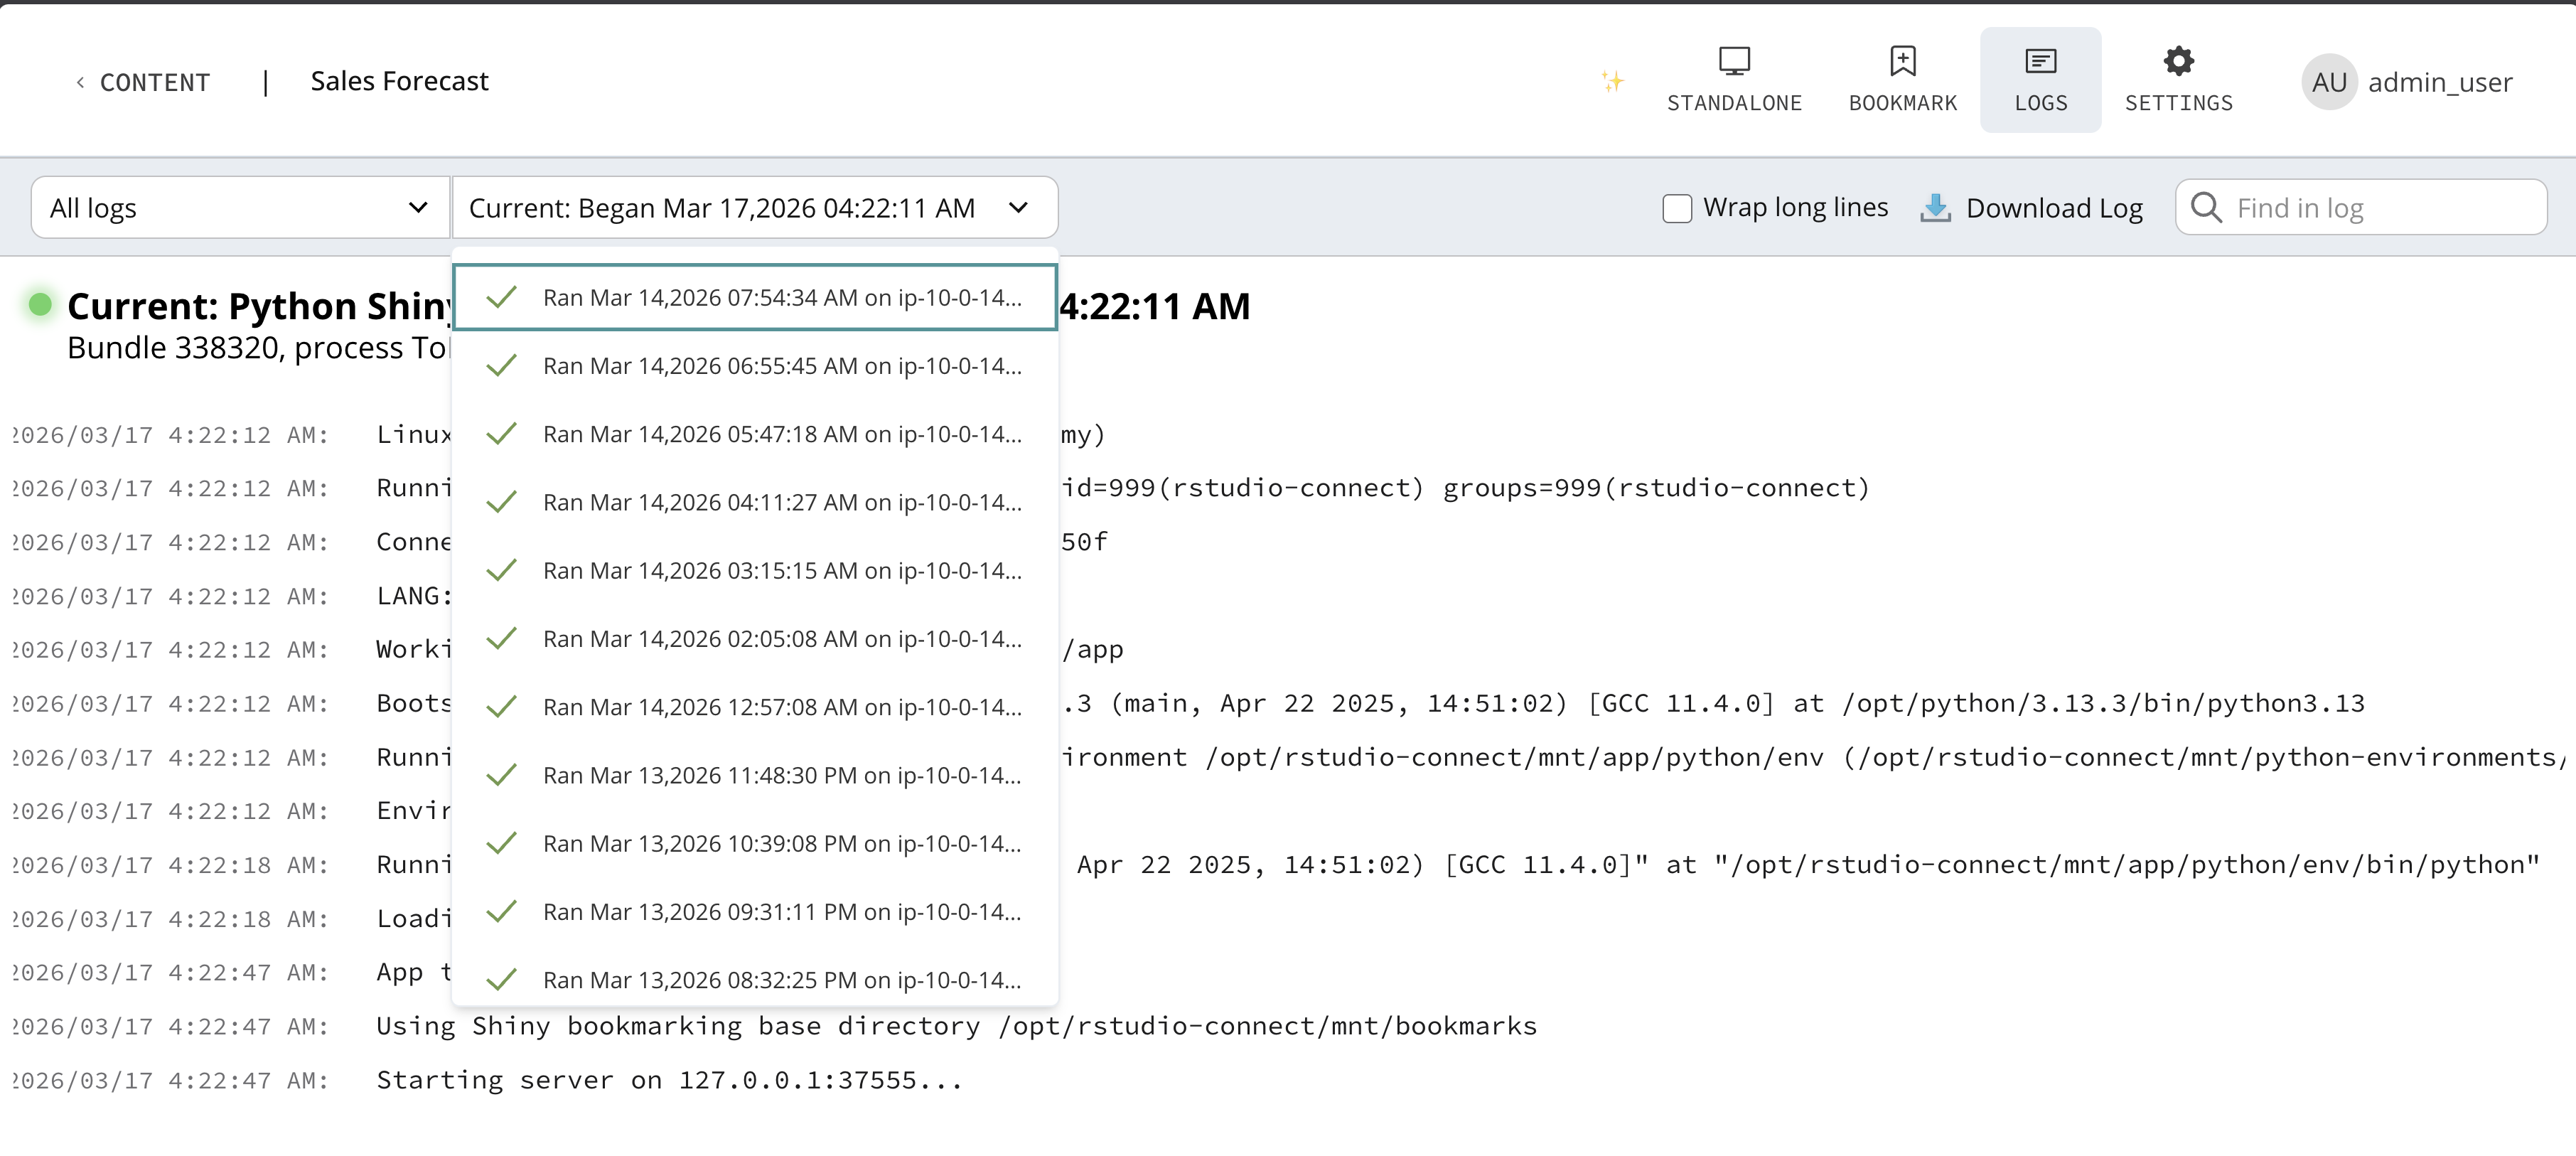
Currently running process logs are indicated by a green live symbol. The log currently shown in the viewer is indicated by a check mark symbol.
Use the filter to narrow the type of logs shown in the Logs Selection drop-down. There are several types of logs available to filter depending on the type of content you are inspecting. Documents published with source code have environment restore logs and render logs. Applications have environment restore logs and process logs.
Truncation
The viewer output may be truncated for log line length (at 4096 characters) and lines shown (at 5000 lines). Truncation prevents performance issues in the browser.
To retrieve the full output of the log file, use the Download button located in the upper right corner of the viewer.
Per-content job metrics
When viewing logs for a job, you can also view resource metrics, including CPU usage, memory consumption, and connection counts. These metrics are displayed as charts alongside the log output, helping you understand the resource usage patterns of your content. To learn more about enabling these metrics for your content see the Per-content job metrics Section of the Content Settings Panel.