Skip the guide and publish the sample document
Publish an R Markdown document to Connect Cloud
Publish an R Markdown document to Connect Cloud from GitHub, Positron or VS Code, RStudio, or the command line. Compare methods and follow the steps.

In this guide, you publish an R Markdown document to Connect Cloud and get a URL you can share. You can publish from GitHub, from Positron or VS Code, from RStudio, or from the command line. The sample document shows the eight viridis color palettes on maps of median high temperatures in the United States.
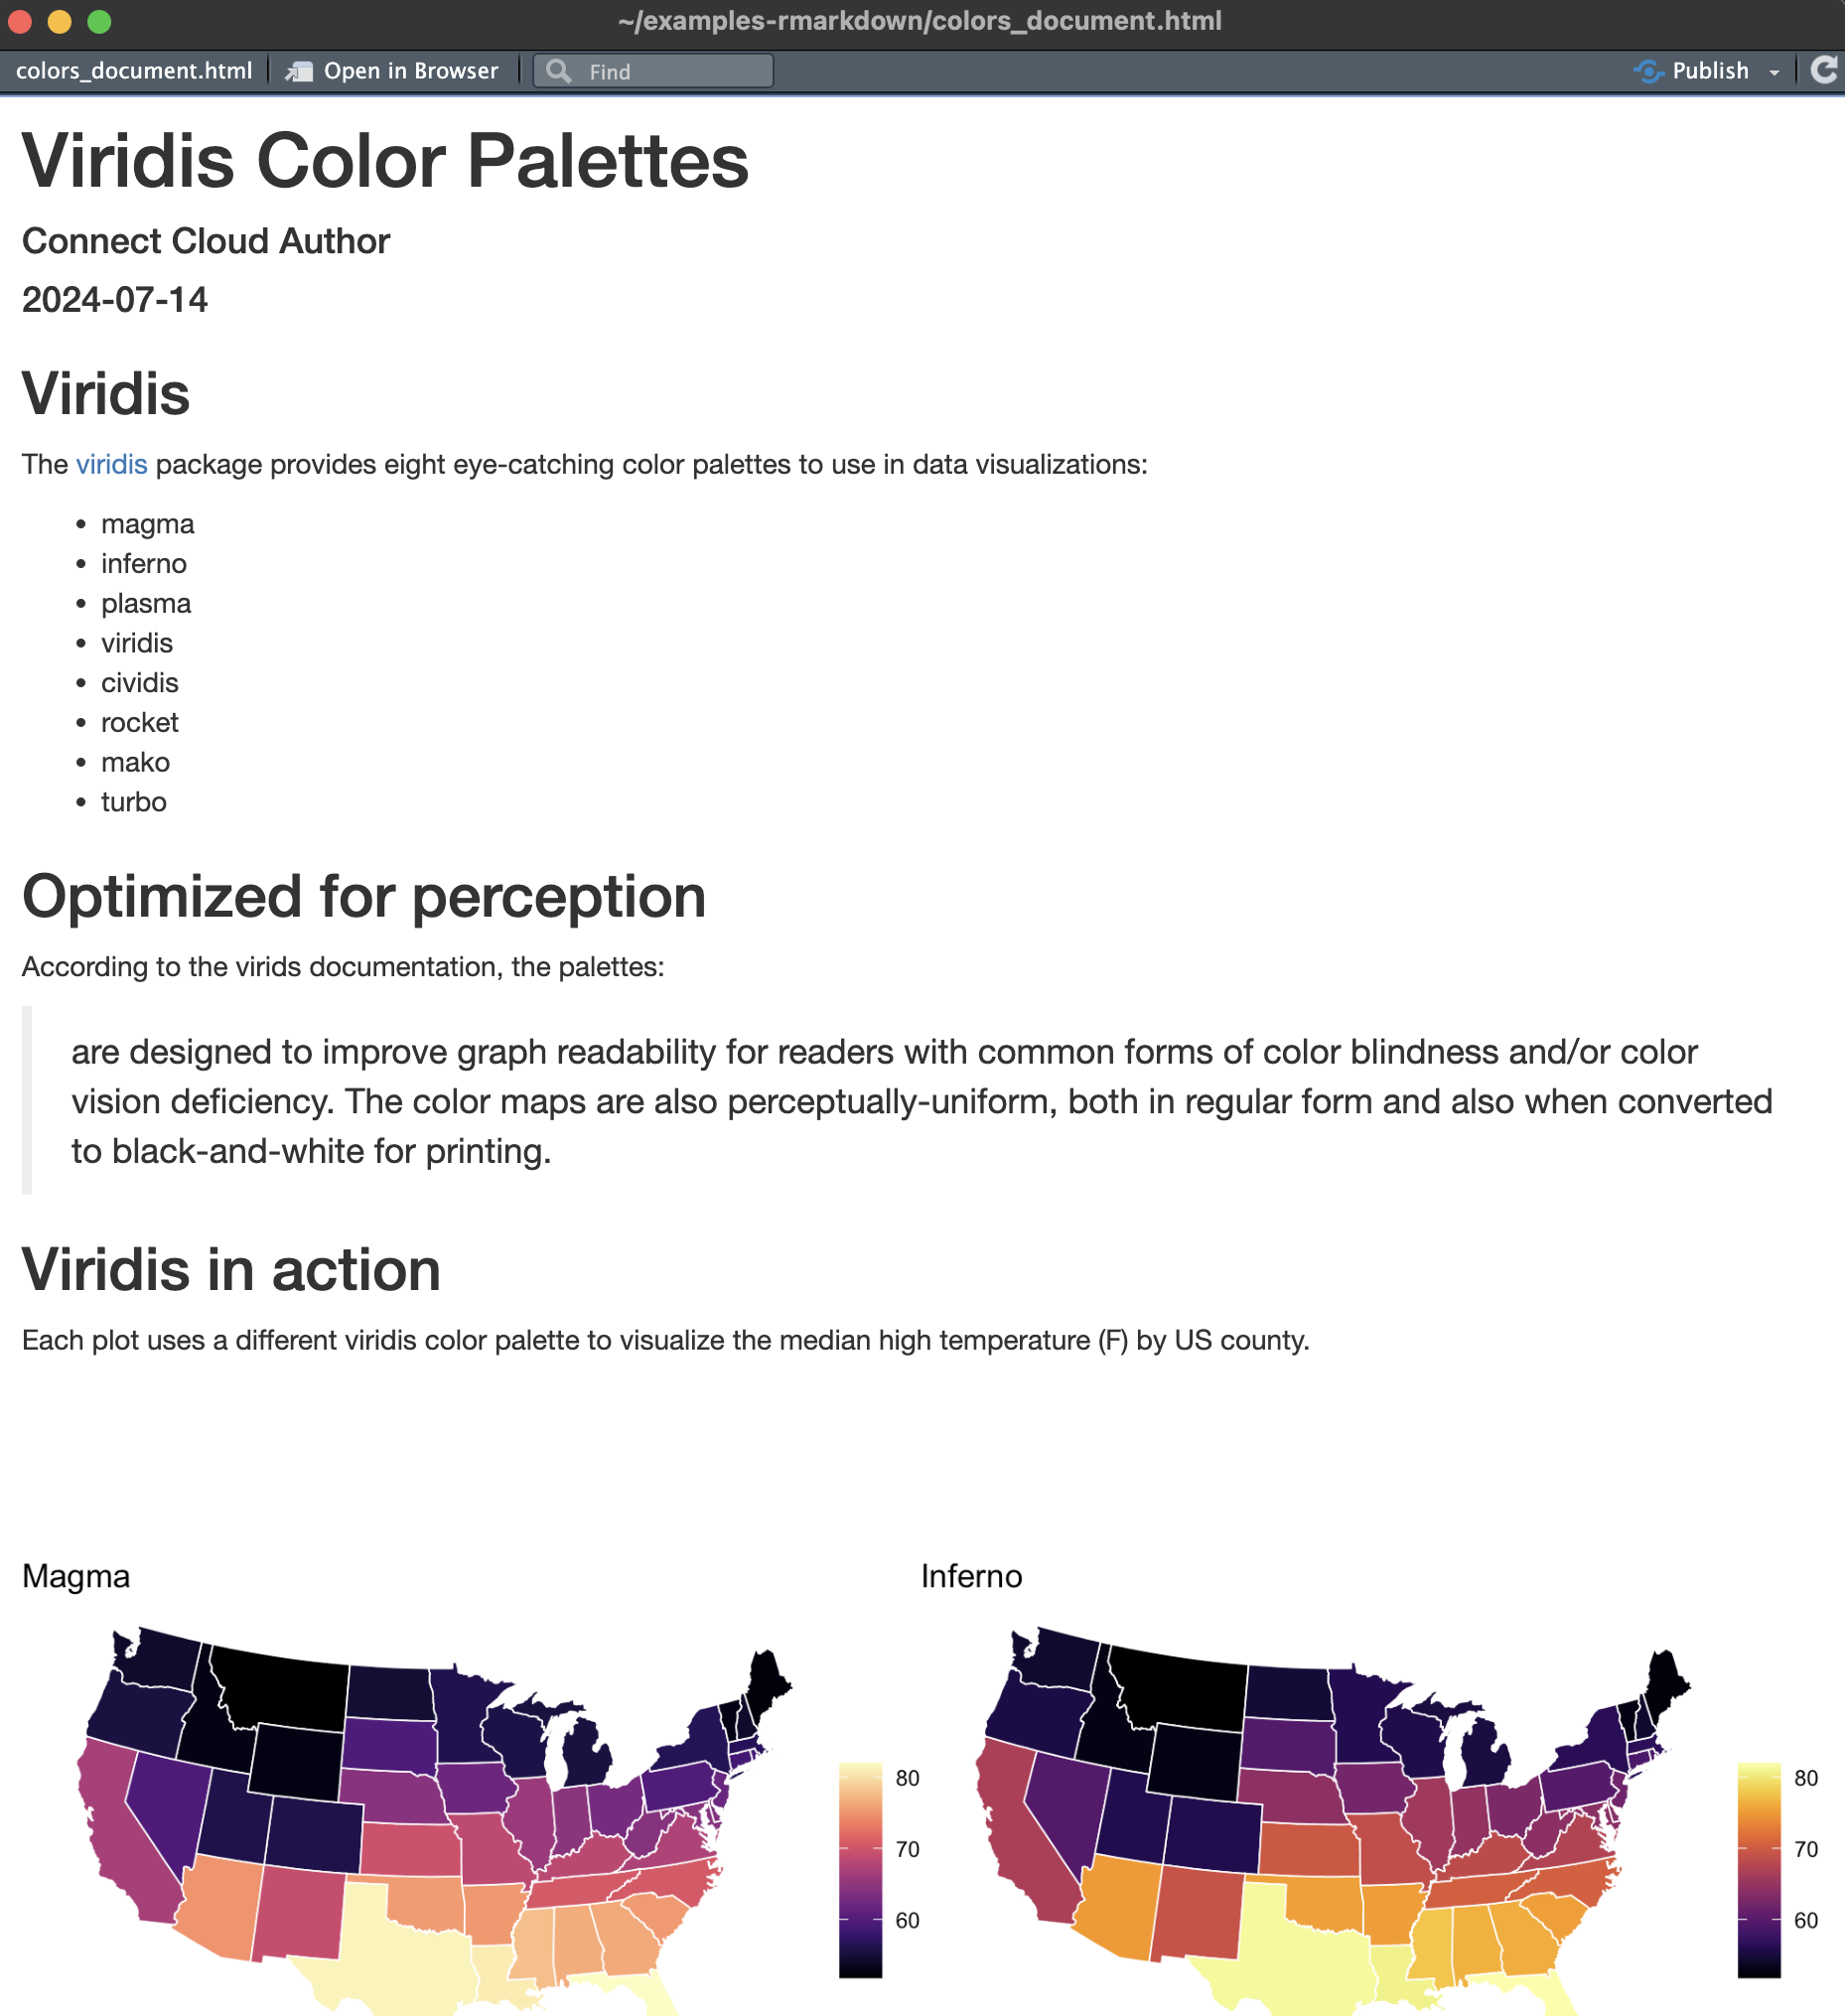
The source code is available in the examples-rmarkdown repository.
Getting started
Whichever method you choose, you need the following:
- A Connect Cloud account.
- An R Markdown document. This guide uses the sample document, which has a main file (Connect Cloud calls it the primary file) named
colors_document.Rmdand a data file atdata/state_medians.csv. - If you publish from GitHub, a
renv.lockormanifest.jsonfile that lists the R packages your content uses. Posit Publisher and push-button publishing do this for you.
NoteView the sample document code
Save this file as colors_document.Rmd.
colors_document.Rmd
---
title: "Viridis Color Palettes"
author: "Connect Cloud Author"
date: "`r Sys.Date()`"
output: html_document
---

```{r setup, include = FALSE}
# Set global knit options (optional)
knitr::opts_chunk$set(echo = FALSE)

# load packages
library(tidyverse)
library(viridis)
library(here)
library(maps)
library(sf)

states_map <-
  map_data("state") |>
  left_join(read_csv(here("data/state_medians.csv")))

#' Create a map of median high temperatures (F) colored
#' with a viridis color palette.
plot_temps <- function(palette = c("magma",
                                   "inferno",
                                   "plasma",
                                   "viridis",
                                   "cividis",
                                   "rocket",
                                   "mako",
                                   "turbo"),
                       title = TRUE) {

  palette_code <- case_match(
    str_to_lower(palette),
    "magma"   ~ "A",
    "inferno" ~ "B",
    "plasma"  ~ "C",
    "viridis" ~ "D",
    "cividis" ~ "E",
    "rocket"  ~ "F",
    "mako"    ~ "G",
    "turbo"   ~ "H"
  )

  states_map |>
    ggplot(aes(x = long, y = lat, fill = med_high, group = group)) +
    geom_polygon(color = "white", linewidth = 0.3) +
    scale_fill_viridis(option = palette_code) +
    coord_sf(
      crs = 5070, default_crs = 4326,
      xlim = c(-125, -70), ylim = c(25, 52)
    ) +
    theme_void() +
    labs(
      title = if_else(
        title,
        str_to_title(palette),
        "Median high temperature (F)"
      ),
      fill = ""
    )
}
```

## Viridis

The [viridis](https://sjmgarnier.github.io/viridis/) package provides eight eye-catching color palettes to use in data visualizations:

- magma
- inferno
- plasma
- viridis
- cividis
- rocket
- mako
- turbo

## Optimized for perception

According to the virids documentation, the palettes:

> are designed to improve graph readability for readers with common forms of color blindness and/or color vision deficiency. The color maps are also perceptually-uniform, both in regular form and also when converted to black-and-white for printing.

## Viridis in action

Each plot uses a different viridis color palette to visualize the median high temperature (F) by US county.

```{r fig.show="hold", fig.width = 5, out.width="50%"}
plot_temps("magma")
plot_temps("inferno")
```

```{r fig.show="hold", fig.width = 5, out.width="50%"}
plot_temps("plasma")
plot_temps("viridis")
```

```{r fig.show="hold", fig.width = 5, out.width="50%"}
plot_temps("cividis")
plot_temps("rocket")
```

```{r fig.show="hold", fig.width = 5, out.width="50%"}
plot_temps("mako")
plot_temps("turbo")
```

## Usage

To use a viridis palette in your plot, include `scale_*_viridis()` in your ggplot2 call:

```{r eval = FALSE, echo = TRUE}
mpg |>
  ggplot(aes(x = displ, y = cty, color = hwy)) +
    geom_point() +
    scale_color_viridis(option = "A")
```
Get data/state_medians.csv from the sample repository.
To preview the document before you publish, open it in RStudio and click Knit, or run this from the folder that contains colors_document.Rmd:
rmarkdown::render("colors_document.Rmd")Choose a deployment method
| Method | When to use it | Jump to |
|---|---|---|
| GitHub | Your code is on GitHub and you want it to update when you push (public repositories only on free accounts) | Deploy from GitHub |
| Posit Publisher | You work in Positron or VS Code and do not use GitHub | Deploy from Positron or VS Code |
| Push-button publishing | You work in RStudio and do not use GitHub | Deploy from RStudio |
| rsconnect | You want to deploy from the R console or automate deployments | Deploy from the command line |
For more on how these methods differ, see Publishing.
Deploy from GitHub
Use this method when your document’s code is in a GitHub repository and you want changes you push to publish automatically. On a free account, your repository must be public, so anyone can see your code.
Create a
manifest.jsonfile by running this in the R console from the folder that containscolors_document.Rmd:rsconnect::writeManifest()Commit
colors_document.Rmd,manifest.json, anddata/state_medians.csv, then push your document to a GitHub repository.Sign in to Connect Cloud.
Click Publish at the top of your Home page. If this is your first time publishing, Connect Cloud prompts you to install the GitHub App, which lets Connect Cloud read your repository.
Select R Markdown.
Select your repository.
Check that Branch is the branch that has your content, usually
main.Select
colors_document.Rmdas the Primary file.Leave Automatically publish on push on if you want Connect Cloud to update what you published each time you push to this branch. Turn it off to update only when you choose.
Click Publish.
- Result: Connect Cloud shows a log of the install steps while it deploys. When it finishes, your document is live at an address like
https://[content-id].share.connect.posit.cloud, where[content-id]is a unique identifier that Connect Cloud picks. You can set a custom name to change the URL. - Update or redeploy: Commit and push to the connected branch and Connect Cloud republishes automatically. If you turned off automatic publishing, click Republish on the content’s card on your Home page. See Republishing.
For all options, see Publish from GitHub.
Deploy from Positron or VS Code
Use this method when you work in Positron or VS Code and want to publish your document directly. Positron includes the Posit Publisher extension. In VS Code, install it from the marketplace first.
- Open your project folder in Positron, or in VS Code with Posit Publisher installed.
- Click the Posit Publisher icon in the Activity Bar.
- Next to CREDENTIALS, click + and select Posit Connect Cloud. A credential is a saved connection to your Connect Cloud account. Your browser opens.
- In your browser, check that the Authorize Access code matches the code in Positron or VS Code. Then click Continue and Authorize.
- Return to Positron or VS Code and accept or change the name for this credential. Do this once.
- Click the + next to Deployments. If Posit Publisher asks which file to publish, select
colors_document.Rmd. - Enter a title for your content, then select the credential you just added.
- Under PROJECT FILES, check that the list includes
colors_document.Rmdanddata/state_medians.csv. Connect Cloud uploads only the files in this list. - Click Deploy Your Project.
- Result: A success message appears in the lower right of Positron or VS Code. Click View Content in the extension to open the document on Connect Cloud. Its address has the form
https://[content-id].share.connect.posit.cloud, where[content-id]is unique to your document. - Update or redeploy: Save your changes, open Posit Publisher, select the previous deployment, and click Deploy Your Project again. Keep the
.positfolder in your project. It remembers which Connect Cloud content this project publishes to, so the next deploy updates the same content instead of creating a new one.
For the configuration file, multiple deployments per project, and troubleshooting, see Publish from your IDE.
Deploy from RStudio
Use this method when you work in RStudio and want to publish your document directly with push-button publishing.
- Open
colors_document.Rmdin RStudio and click Knit. - Click Publish in the toolbar of the rendered document.
- Follow the prompts to connect your Connect Cloud account and publish.
- Result: RStudio opens your document on Connect Cloud.
- Update or redeploy: Knit the document again and click Publish.
For setup instructions and supported content types, see Publish from your IDE and the RStudio IDE publishing documentation.
Deploy from the command line
Use this method to script deployments from the R console with the rsconnect package. You do not need a manifest.json or renv.lock file for this method.
Install the package.
install.packages("rsconnect")Add your Connect Cloud account. Your browser opens for you to authorize access.
rsconnect::connectCloudUser()Deploy the document.
rsconnect::deployDoc("colors_document.Rmd")
If you have several accounts configured, rsconnect asks which one to use.
- Result: A successful deployment opens your browser to your content’s page on Connect Cloud.
- Update or redeploy: Run
rsconnect::deployDoc("colors_document.Rmd")again.
For noninteractive credentials and other options, see Publish from your console or terminal.
After you deploy
Common things to set up next. They work the same however you deployed your document:
- Passwords and API keys: Store them as secret variables, not in your code. Add them under Variables in content settings, or during publishing. Read them with
Sys.getenv("NAME"). - Access and sharing: Control who can view your document in Sharing.
- Scheduling: On paid plans, schedule your document to republish at set times, for example, to refresh data each day.
- Custom name and domain: Change the document’s URL with a custom name or a custom domain.
- Upload size limit: The upload size limit applies when you upload your project files from your editor, the R console, or the command line.
Troubleshooting
- Missing package error: Re-run
rsconnect::writeManifest()somanifest.jsonlists every package your document loads, then commit it and republish. - Repository not listed: Confirm that the GitHub App has access to it.
- Missing data file: Commit the file to the repository, or include it in the upload. Keep it in the
datafolder, because the document reads it by that relative path.
If your deployment still fails, read the log that Connect Cloud shows while it deploys and look for the first error. You can also try Error Assist, which gives guidance based on your log output.