Skip the tutorial and deploy the example now
Deploy a Shiny Application with R to Connect Cloud

This tutorial builds a Shiny application using R and deploys it to Posit Connect Cloud. The project is a simplified version of code available on GitHub.
1. Create a new GitHub repository
Sign in to GitHub and create a new, public repository.
2. Start a new RStudio project
In RStudio:
- Click New Project from the File menu
- Select Version Control
- Select Git
- Paste the URL to your repository in the Repository URL field
- Enter a Desired Project directory name
- Confirm or change the subdirectory location
Now that your project is synced with your GitHub repository, you are ready to begin coding.
From the New File dropdown or the New File option from the File menu:
- Select R Script
- Save the blank file as
app.R
3. Build the application
Copy and paste the code below into app.R.
# Load packages used by the app. Install missing packages, if needed.
library(shiny)
library(bslib)
library(thematic)
library(tidyverse)
library(gitlink)
# Read data from a CSV file and perform data preprocessing
expansions <- read_csv("data/expansions.csv") |>
mutate(evaluation = factor(evaluation, levels = c("None", "A", "B")),
propensity = factor(propensity, levels = c("Good", "Average", "Poor")))
# Compute expansion rates by trial and group
expansion_groups <- expansions |>
group_by(industry, propensity, contract, evaluation) |>
summarize(success_rate = round(mean(outcome == "Won")* 100),
avg_amount = round(mean(amount)),
avg_days = round(mean(days)),
n = n()) |>
ungroup()
# Compute expansion rates by trial
overall_rates <- expansions |>
group_by(evaluation) |>
summarise(rate = round(mean(outcome == "Won"), 2))
# Restructure expansion rates by trial as a vector
rates <- structure(overall_rates$rate, names = overall_rates$evaluation)
# Define lists for propensity, contract and industry choices
propensities <- c("Good", "Average", "Poor")
contracts <- c("Monthly", "Annual")
industries <- c("Academia",
"Energy",
"Finance",
"Government",
"Healthcare",
"Insurance",
"Manufacturing",
"Non-Profit",
"Pharmaceuticals",
"Technology")
# Set the default theme for ggplot2 plots
ggplot2::theme_set(ggplot2::theme_minimal())
# Apply the CSS used by the Shiny app to the ggplot2 plots
thematic_shiny()
# Define the Shiny UI layout
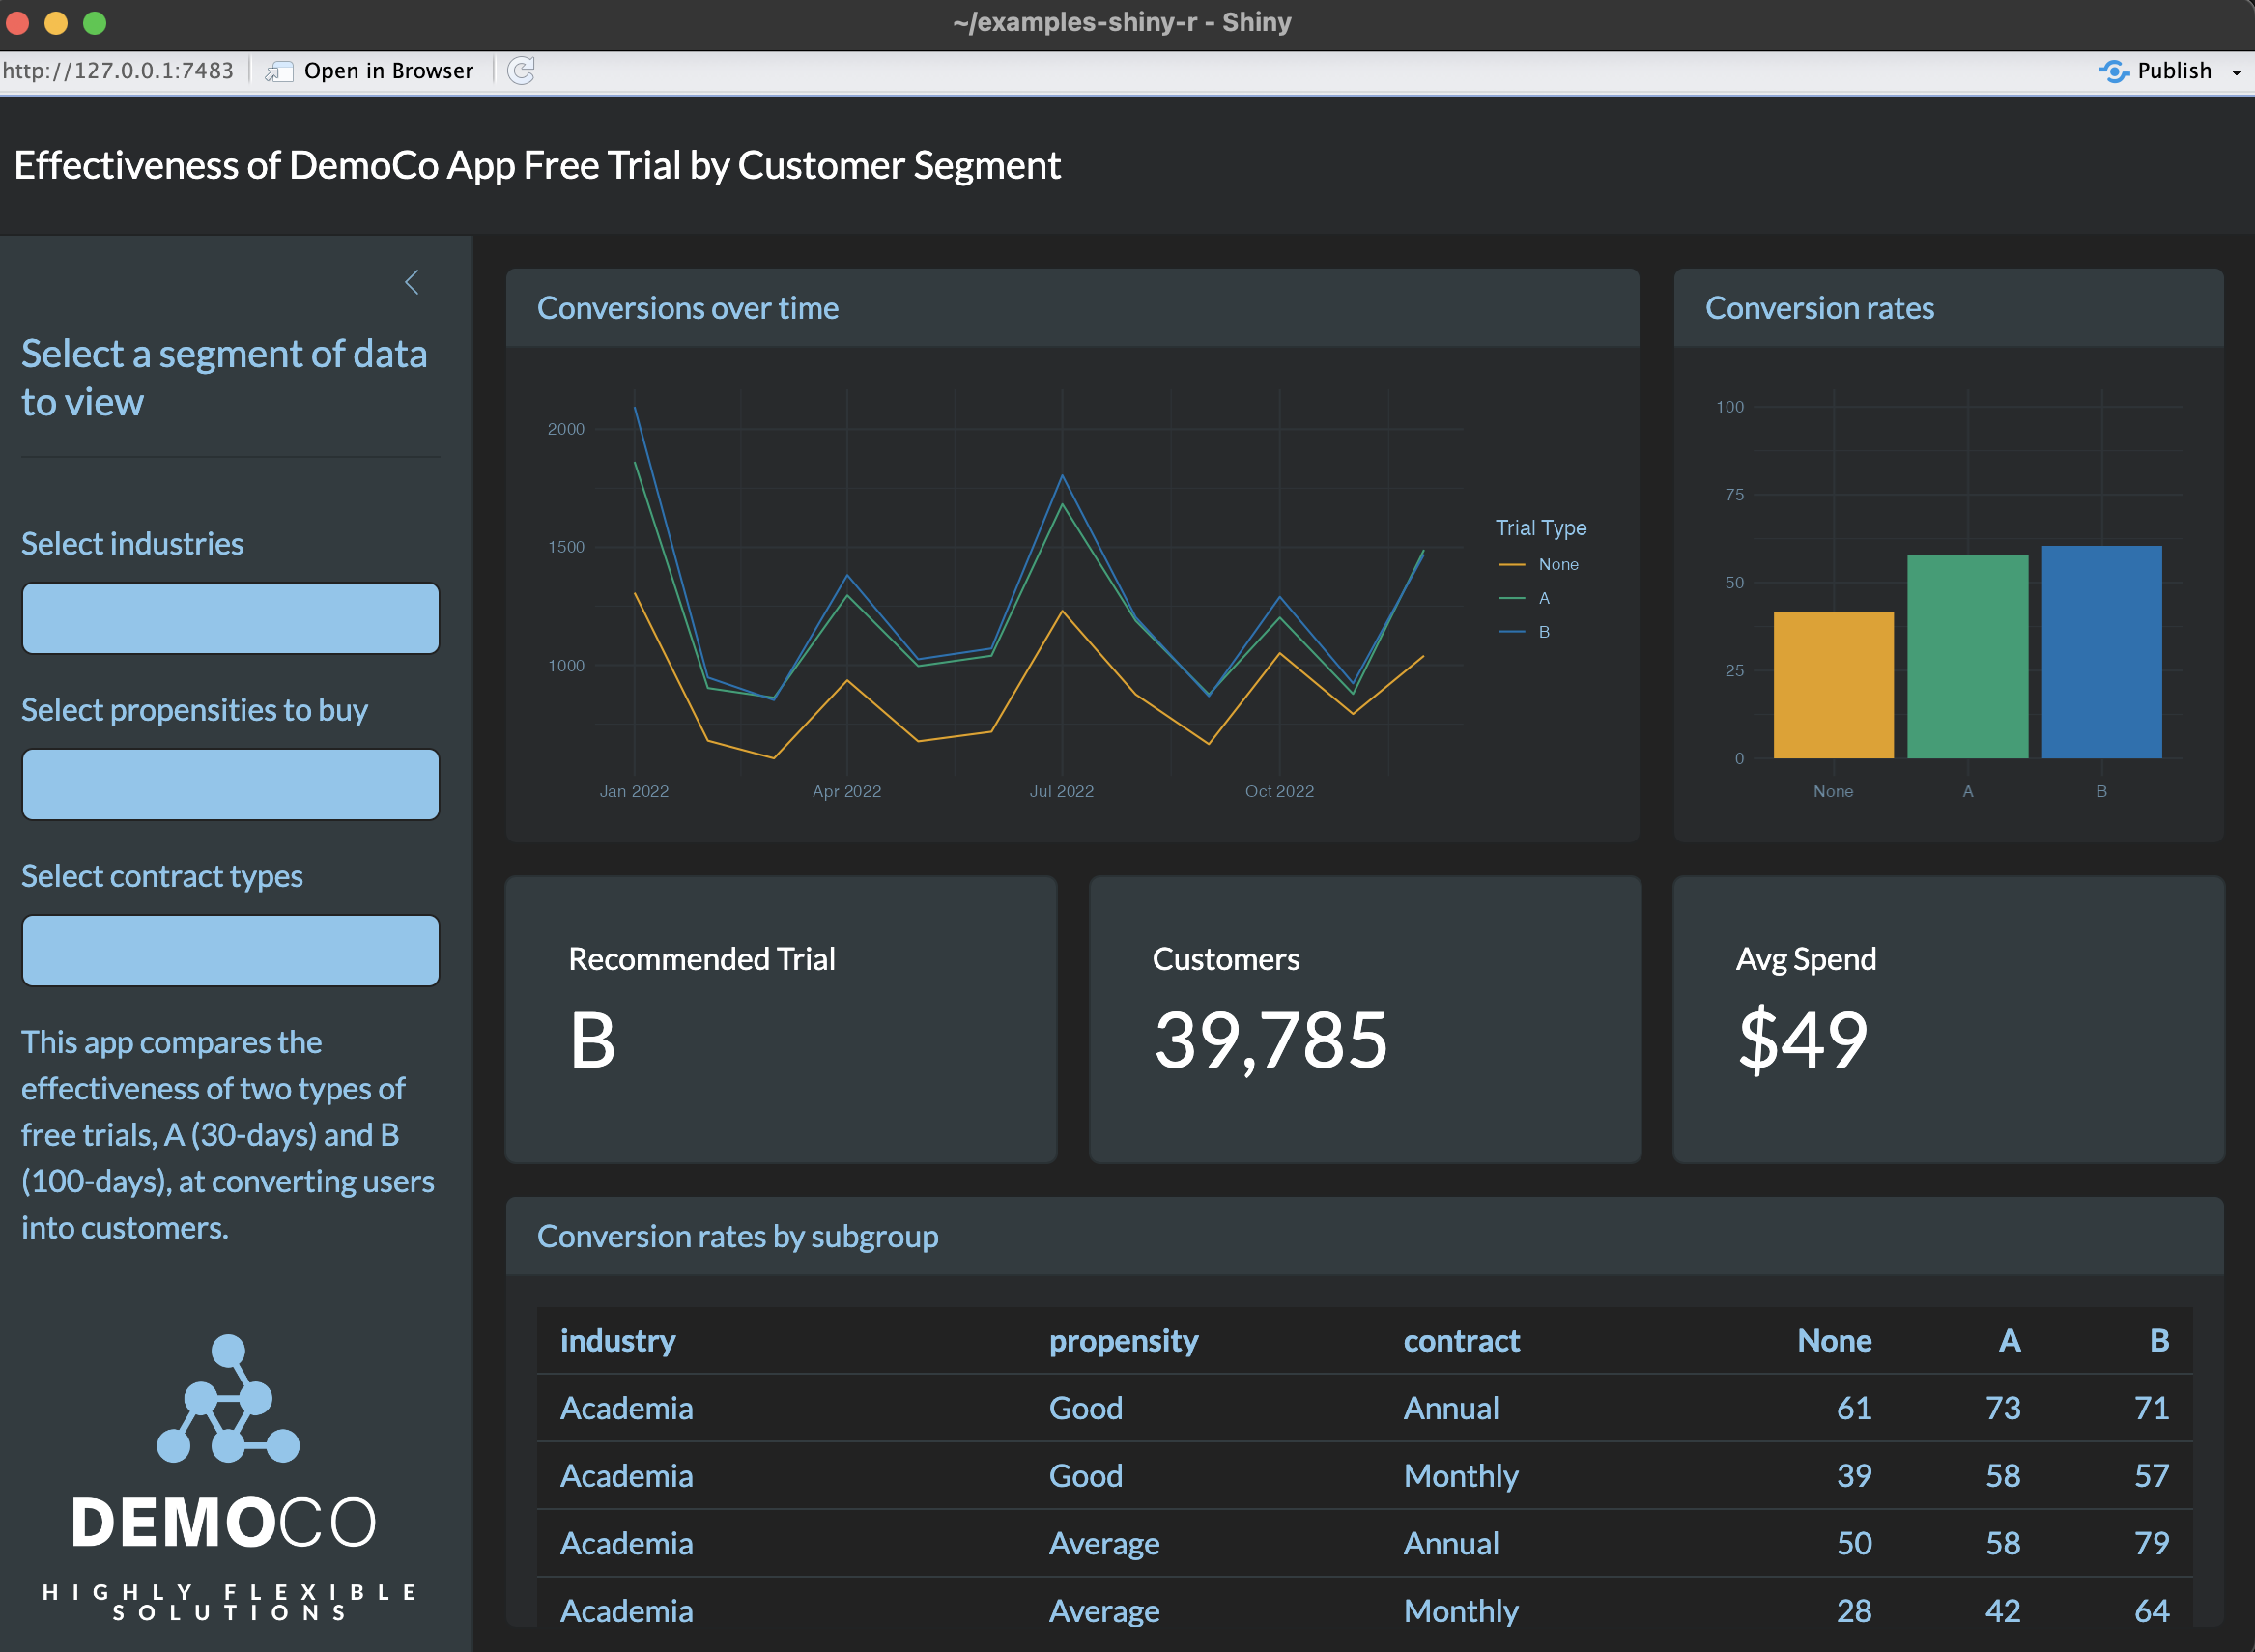
ui <- page_sidebar(
# Set CSS theme
theme = bs_theme(bootswatch = "darkly",
bg = "#222222",
fg = "#86C7ED",
success ="#86C7ED"),
# Add title
title = "Effectiveness of DemoCo App Free Trial by Customer Segment",
# Add sidebar elements
sidebar = sidebar(title = "Select a segment of data to view",
class ="bg-secondary",
selectInput("industry", "Select industries", choices = industries, selected = "", multiple = TRUE),
selectInput("propensity", "Select propensities to buy", choices = propensities, selected = "", multiple = TRUE),
selectInput("contract", "Select contract types", choices = contracts, selected = "", multiple = TRUE),
"This app compares the effectiveness of two types of free trials, A (30-days) and B (100-days), at converting users into customers.",
tags$img(src = "logo.png", width = "100%", height = "auto")),
# Layout non-sidebar elements
layout_columns(card(card_header("Conversions over time"),
plotOutput("line")),
card(card_header("Conversion rates"),
plotOutput("bar")),
value_box(title = "Recommended Trial",
value = textOutput("recommended_eval"),
theme_color = "secondary"),
value_box(title = "Customers",
value = textOutput("number_of_customers"),
theme_color = "secondary"),
value_box(title = "Avg Spend",
value = textOutput("average_spend"),
theme_color = "secondary"),
card(card_header("Conversion rates by subgroup"),
tableOutput("table")),
col_widths = c(8, 4, 4, 4, 4, 12),
row_heights = c(4, 1.5, 3))
)
# Define the Shiny server function
server <- function(input, output) {
# Provide default values for industry, propensity, and contract selections
selected_industries <- reactive({
if (is.null(input$industry)) industries else input$industry
})
selected_propensities <- reactive({
if (is.null(input$propensity)) propensities else input$propensity
})
selected_contracts <- reactive({
if (is.null(input$contract)) contracts else input$contract
})
# Filter data against selections
filtered_expansions <- reactive({
expansions |>
filter(industry %in% selected_industries(),
propensity %in% selected_propensities(),
contract %in% selected_contracts())
})
# Compute conversions by month
conversions <- reactive({
filtered_expansions() |>
mutate(date = floor_date(date, unit = "month")) |>
group_by(date, evaluation) |>
summarize(n = sum(outcome == "Won")) |>
ungroup()
})
# Retrieve conversion rates for selected groups
groups <- reactive({
expansion_groups |>
filter(industry %in% selected_industries(),
propensity %in% selected_propensities(),
contract %in% selected_contracts())
})
# Render text for recommended trial
output$recommended_eval <- renderText({
recommendation <-
filtered_expansions() |>
group_by(evaluation) |>
summarise(rate = mean(outcome == "Won")) |>
filter(rate == max(rate)) |>
pull(evaluation)
as.character(recommendation[1])
})
# Render text for number of customers
output$number_of_customers <- renderText({
sum(filtered_expansions()$outcome == "Won") |>
format(big.mark = ",")
})
# Render text for average spend
output$average_spend <- renderText({
x <-
filtered_expansions() |>
filter(outcome == "Won") |>
summarise(spend = round(mean(amount))) |>
pull(spend)
str_glue("${x}")
})
# Render line plot for conversions over time
output$line <- renderPlot({
ggplot(conversions(), aes(x = date, y = n, color = evaluation)) +
geom_line() +
theme(axis.title = element_blank()) +
labs(color = "Trial Type")
})
# Render bar plot for conversion rates by subgroup
output$bar <- renderPlot({
groups() |>
group_by(evaluation) |>
summarise(rate = round(sum(n * success_rate) / sum(n), 2)) |>
ggplot(aes(x = evaluation, y = rate, fill = evaluation)) +
geom_col() +
guides(fill = "none") +
theme(axis.title = element_blank()) +
scale_y_continuous(limits = c(0, 100))
})
# Render table for conversion rates by subgroup
output$table <- renderTable({
groups() |>
select(industry, propensity, contract, evaluation, success_rate) |>
pivot_wider(names_from = evaluation, values_from = success_rate)
},
digits = 0)
}
# Create the Shiny app
shinyApp(ui = ui, server = server)Add the data file
This application uses a data file named expansions.csv that is available here.
To add it to your project:
- Create a new folder named
data - Create a new Text File named
expansions.csvwithin thedatafolder - Copy and paste the data from the link above into your
expansions.csvfile
Preview the application
In RStudio when looking at app.R, click the Run button. This previews your application locally.
Add dependency file
The last thing you need to do is create a dependency file that will provide Connect Cloud with enough information to rebuild your content during deployment. Although there are multiple approaches to achieve this, Connect Cloud exclusively uses a manifest.json file.
To create this file, load the rsconnect library and run the writeManifest() function.
rsconnect::writeManifest()This function creates a .json file named manifest.json that will tell Connect Cloud (1) what version of R to use and (2) what packages and versions are required.
3. Push to GitHub
Now that everything looks good and we’ve created a file to help reproduce your local environment, it is time to get the code on GitHub.
- Navigate to the Git tab in your RStudio project
- Click Commit
- Select the checkbox to stage each new or revised file
- Enter a commit message
- Click Commit
- Click the Push icon
Your repository now has everything it needs for Connect Cloud.
4. Deploy to Posit Connect Cloud
Follow the steps below to deploy your project to Connect Cloud.
Sign in to Connect Cloud.
Click the Publish icon button on the top of your Home page
Select Shiny
Select the public repository that you created in this tutorial
Confirm the branch
Select app.R as the primary file
Click Publish
Publishing will display status updates during the deployment process. You will also find build logs streaming on the lower part of the screen.
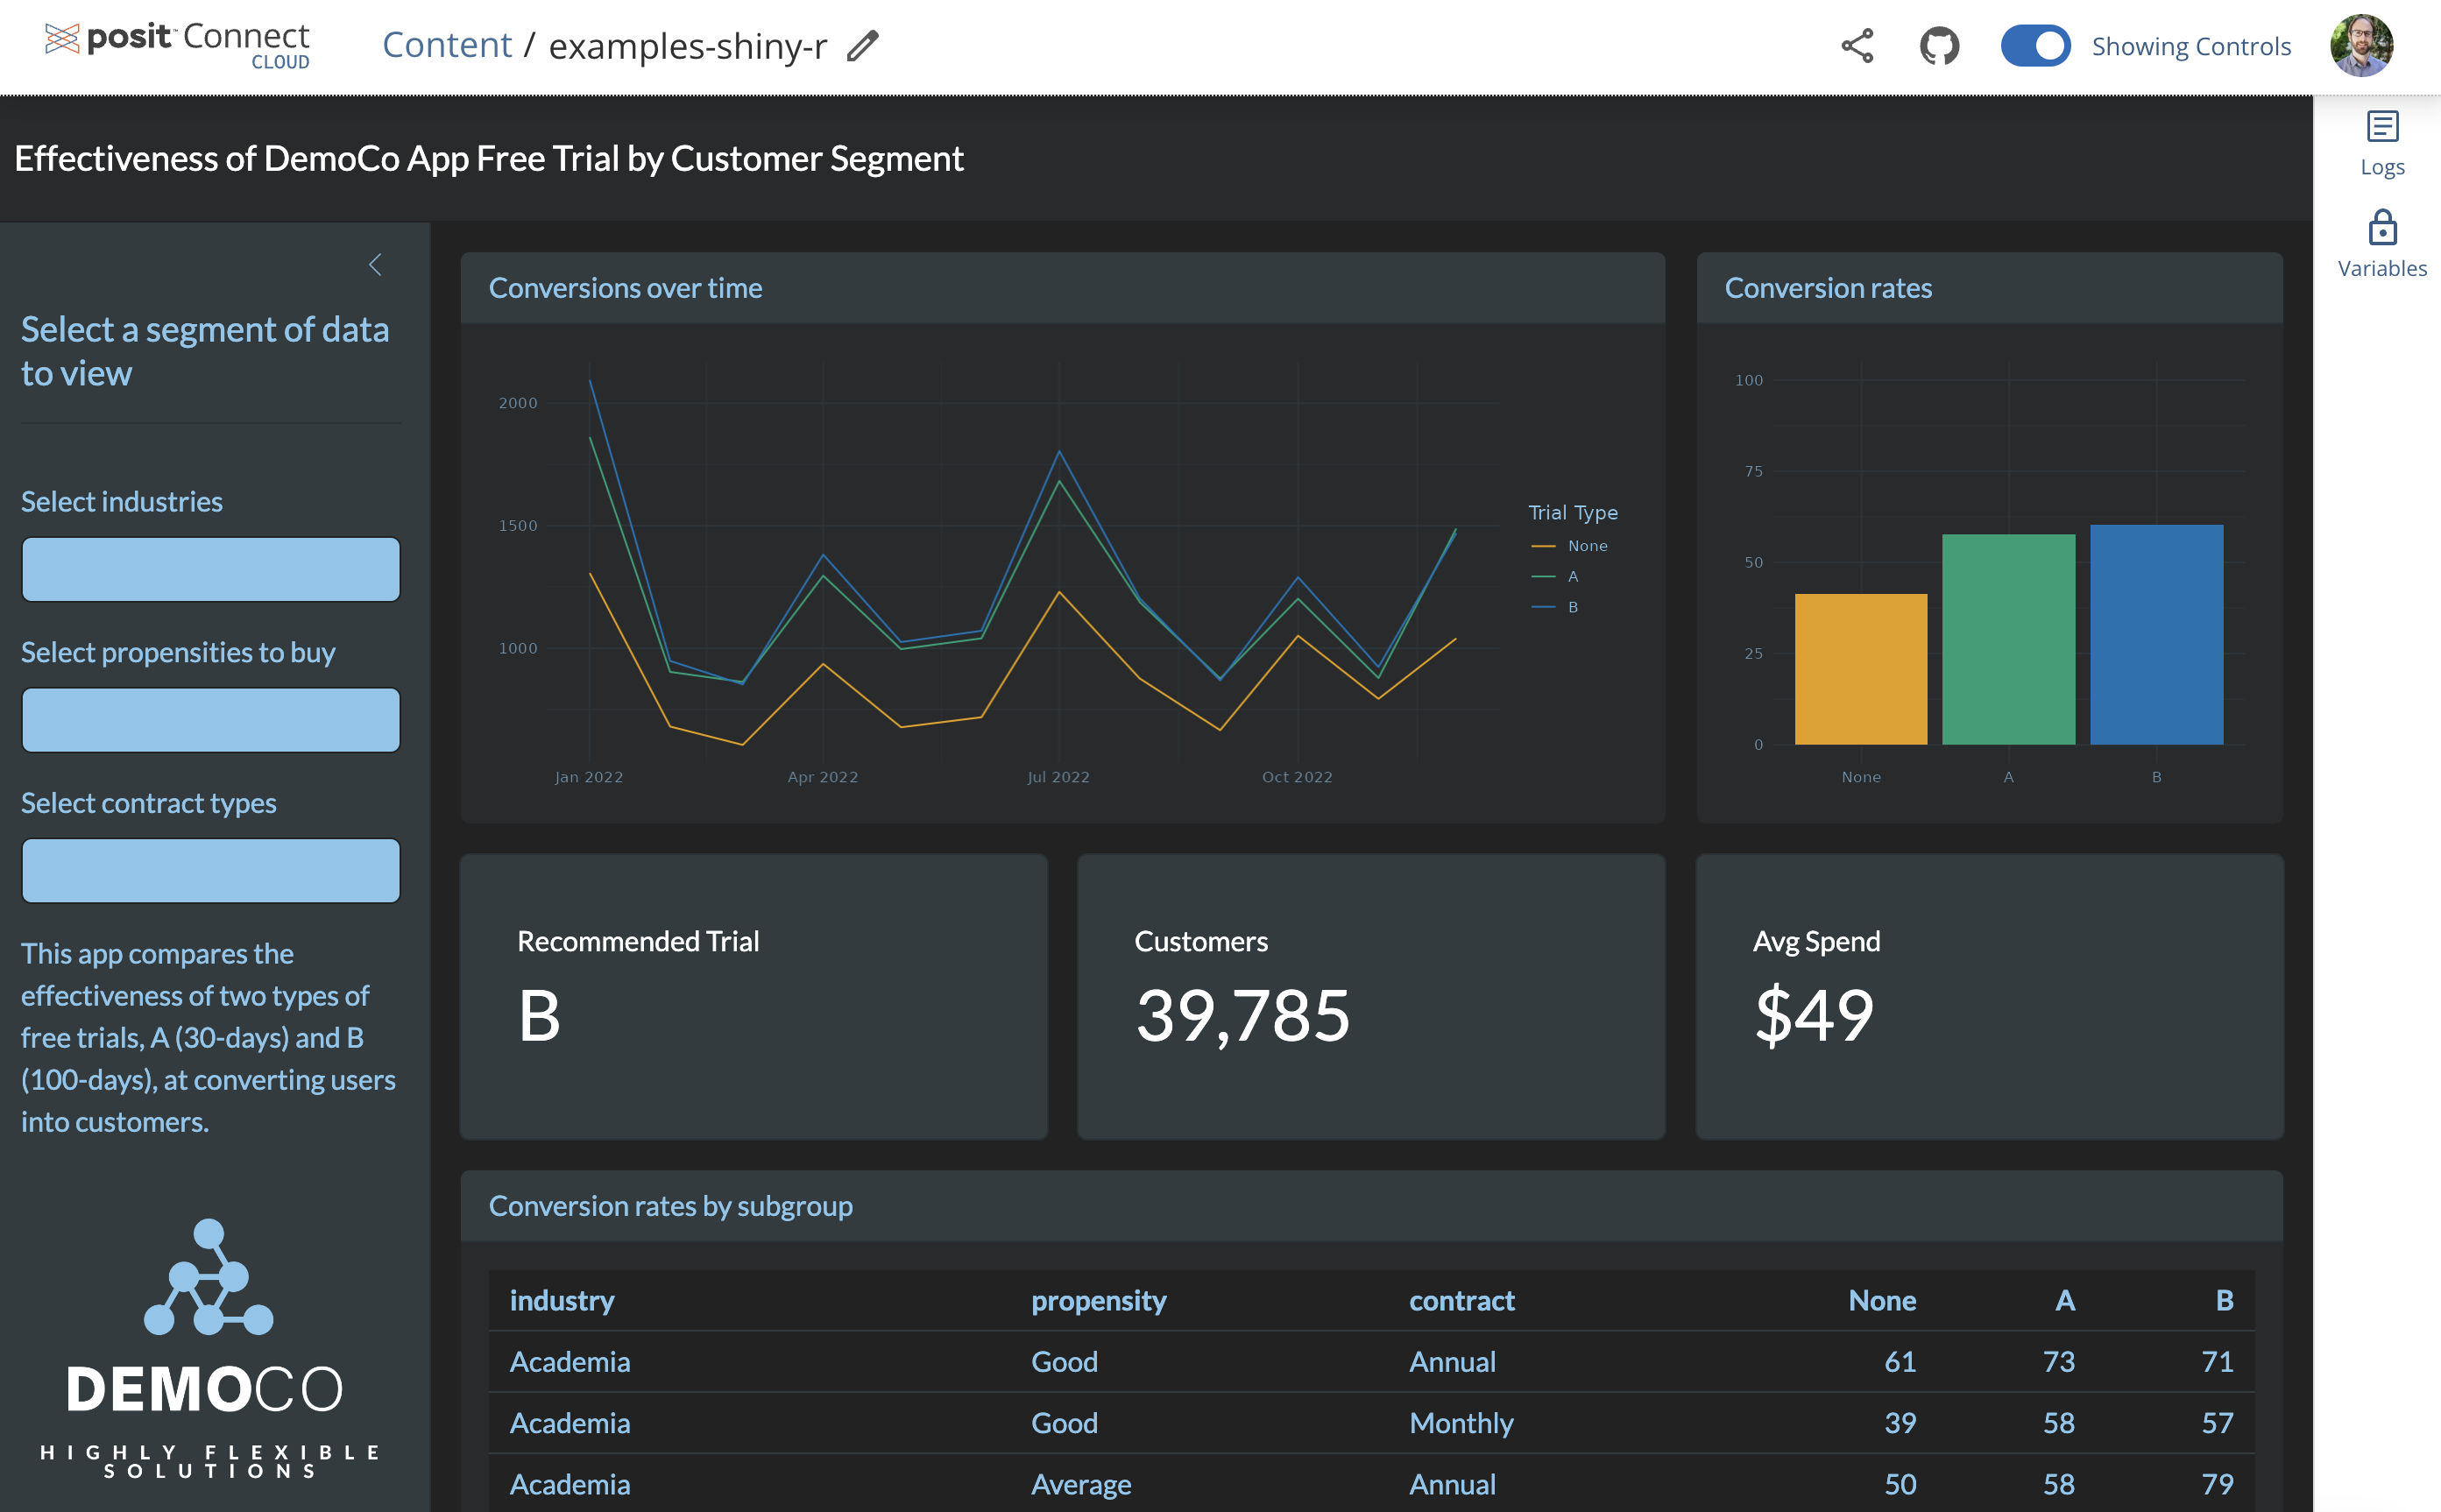
Congratulations! You successfully deployed to Connect Cloud and are now able to share the link with others.
5. Republish the application
If you update the code to your application or the underlying data source, commit and push the changes to your GitHub repository.
Once the repository has the updated code, you can republish the application on Connect Cloud by going to your Content List and clicking the republish icon.