Skip the tutorial and deploy the example now
Deploy a Shiny for Python App to Connect Cloud

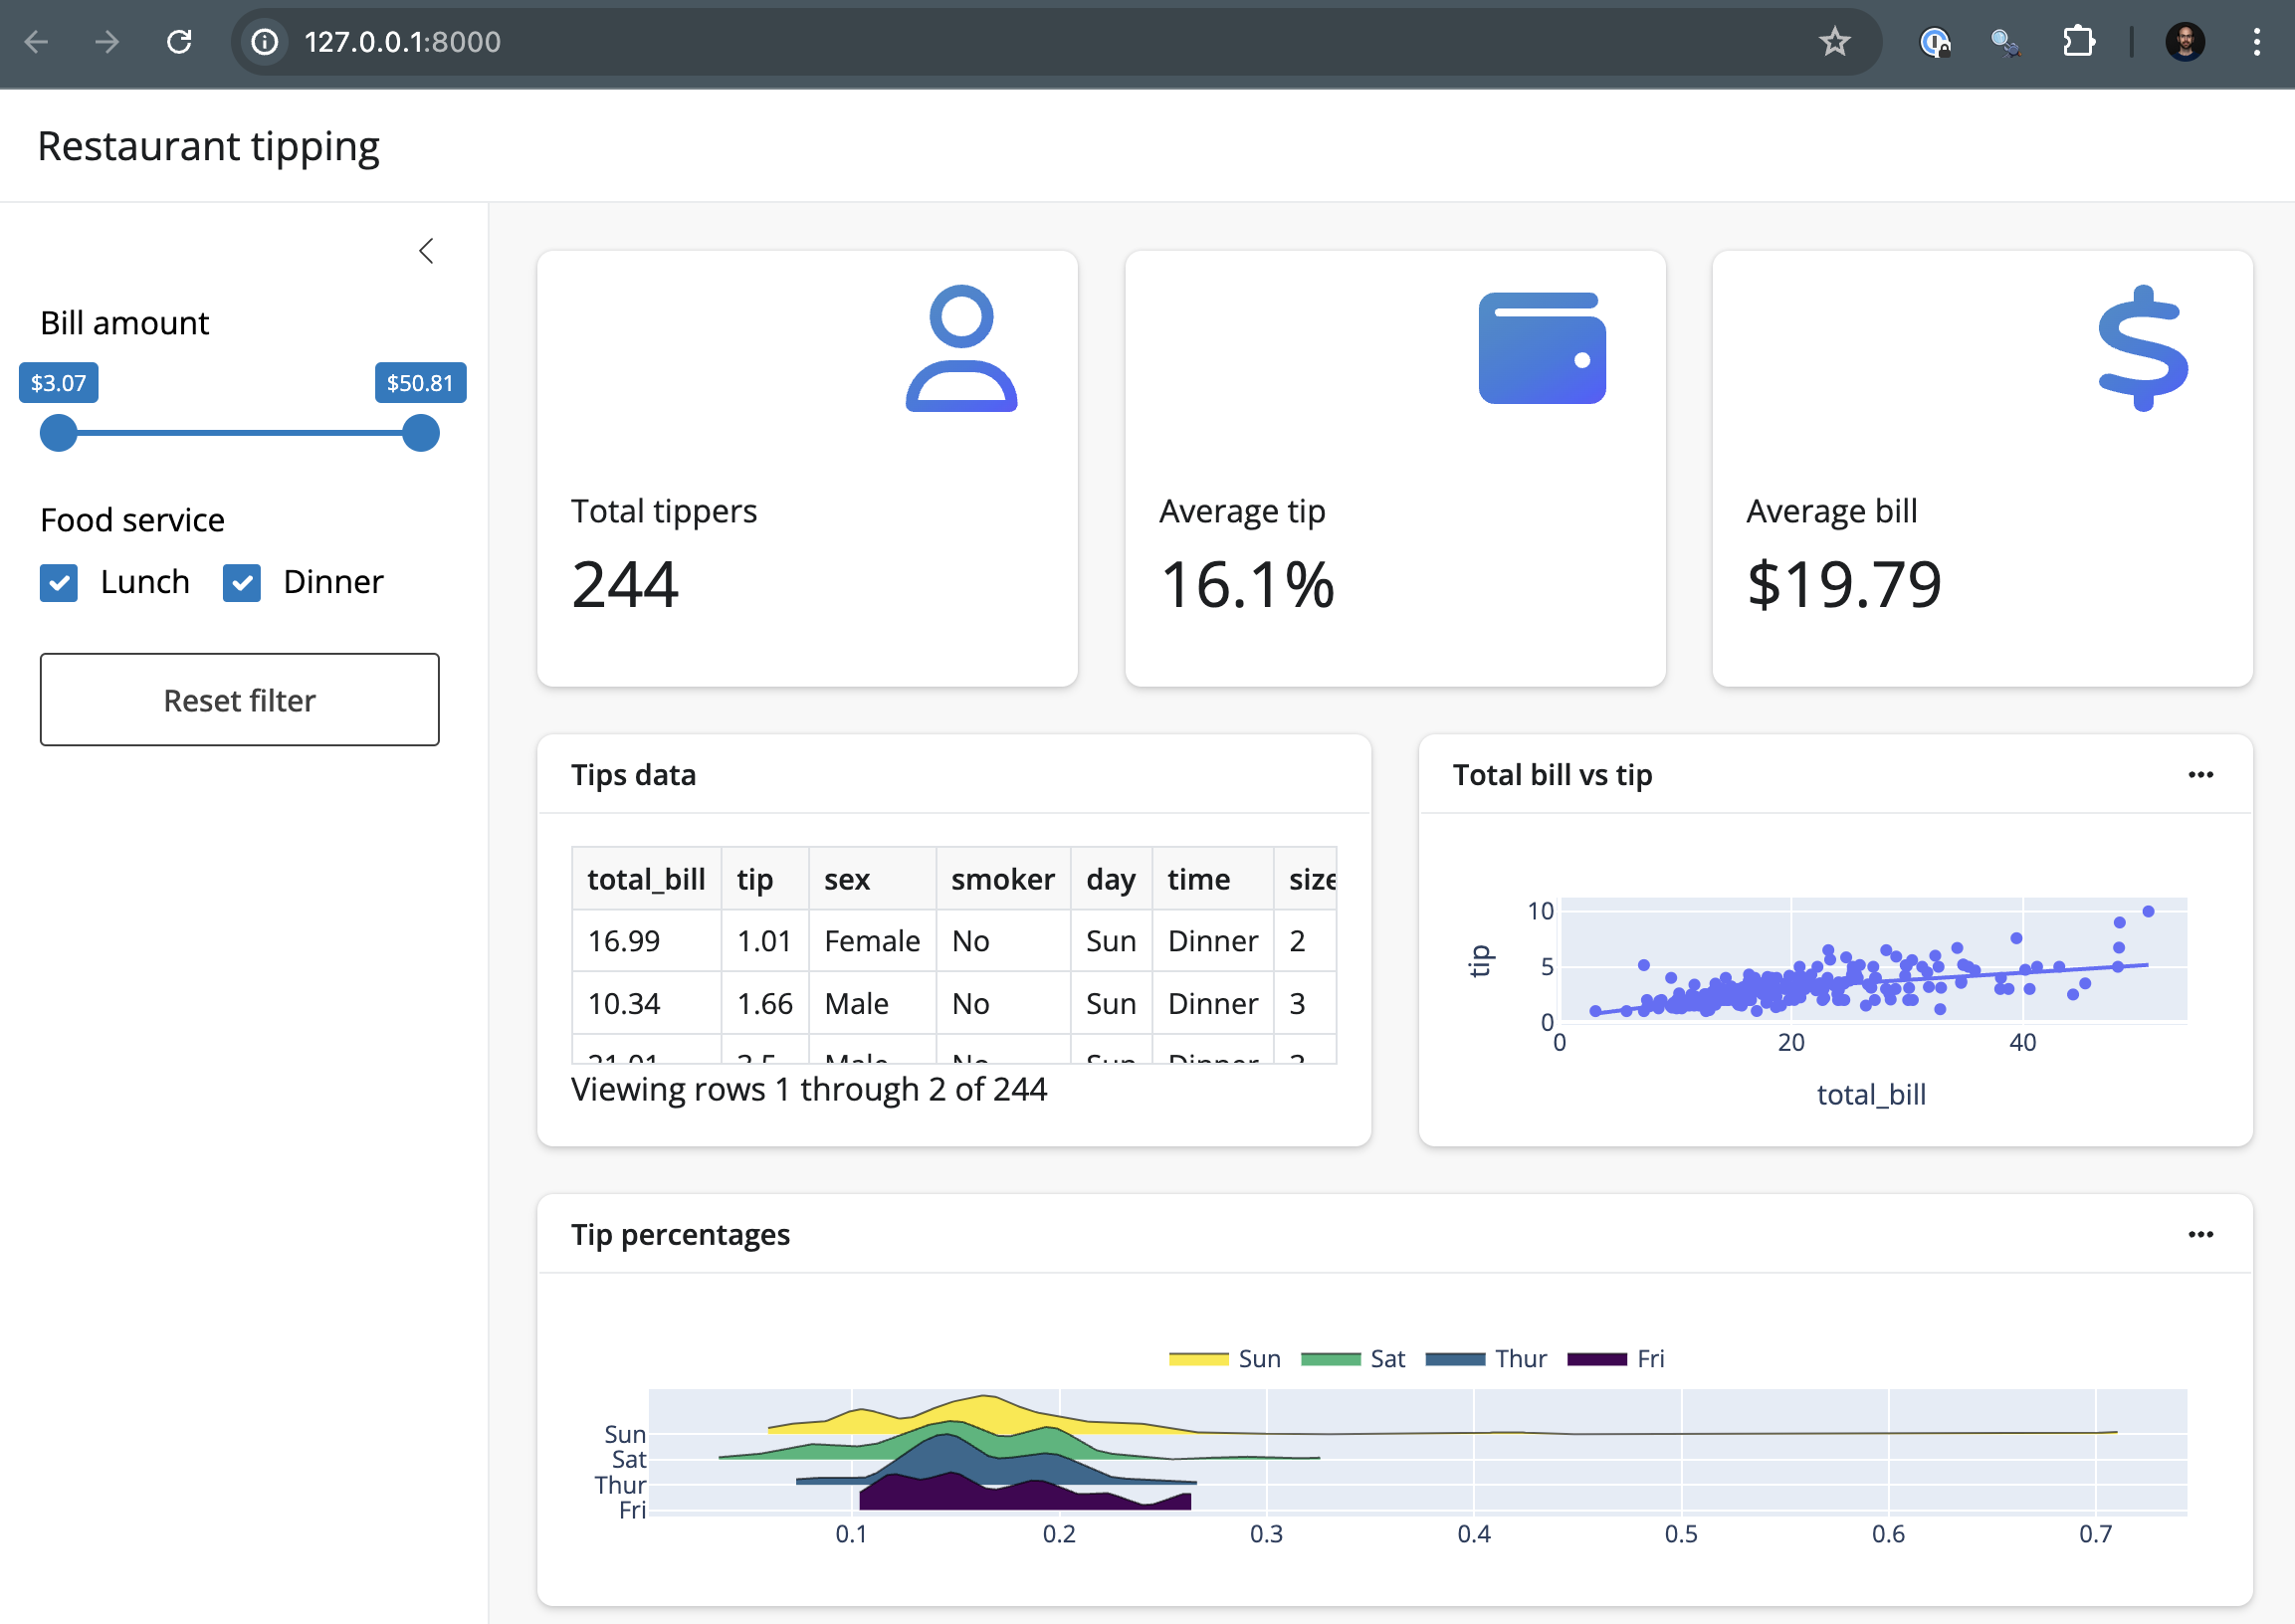
This end-to-end example creates a Shiny for Python application and deploys it to Posit Connect Cloud. Code for the application is available on GitHub.
1. Build the application
Begin with a new project in your preferred development environment. In the terminal, create a virtual environment named venv and activate it. This will isolate the specific packages we need for the the application.
python -m venv venv
source venv/bin/activate
Now we want to install the required packages for this application in the virtual environment. Create a requirements.txt file, adding each package on a new line. This file helps install everything the application needs to run locally, as well as ultimately tell Connect Cloud what it needs to deploy the application.
faicons
shiny
shinywidgets
plotly
pandas
ridgeplot
Once you have saved requirements.txt, run the following command in the terminal to install all the packages in your virtual environment.
pip install -r requirements.txtCreate the primary file
Next, create a file named app.py and add the following code for the Shiny application.
import faicons as fa
import plotly.express as px
import pandas as pd

# Load data and compute static values
from shiny import reactive, render
from shiny.express import input, ui
from shinywidgets import render_plotly

tips = pd.read_csv("data/tips.csv")
ui.include_css("styles.css")

bill_rng = (min(tips.total_bill), max(tips.total_bill))

# Add page title and sidebar
ui.page_opts(title="Restaurant tipping", fillable=True)

with ui.sidebar(open="desktop"):
    ui.input_slider(
        "total_bill",
        "Bill amount",
        min=bill_rng[0],
        max=bill_rng[1],
        value=bill_rng,
        pre="$",
    )
    ui.input_checkbox_group(
        "time",
        "Food service",
        ["Lunch", "Dinner"],
        selected=["Lunch", "Dinner"],
        inline=True,
    )
    ui.input_action_button("reset", "Reset filter")

# Add main content
ICONS = {
    "user": fa.icon_svg("user", "regular"),
    "wallet": fa.icon_svg("wallet"),
    "currency-dollar": fa.icon_svg("dollar-sign"),
    "ellipsis": fa.icon_svg("ellipsis"),
}

with ui.layout_columns(fill=False):
    with ui.value_box(showcase=ICONS["user"]):
        "Total tippers"

        @render.express
        def total_tippers():
            tips_data().shape[0]

    with ui.value_box(showcase=ICONS["wallet"]):
        "Average tip"

        @render.express
        def average_tip():
            d = tips_data()
            if d.shape[0] > 0:
                perc = d.tip / d.total_bill
                f"{perc.mean():.1%}"

    with ui.value_box(showcase=ICONS["currency-dollar"]):
        "Average bill"

        @render.express
        def average_bill():
            d = tips_data()
            if d.shape[0] > 0:
                bill = d.total_bill.mean()
                f"${bill:.2f}"


with ui.layout_columns(col_widths=[6, 6, 12]):
    with ui.card(full_screen=True):
        ui.card_header("Tips data")

        @render.data_frame
        def table():
            return render.DataGrid(tips_data())

    with ui.card(full_screen=True):
        with ui.card_header(class_="d-flex justify-content-between align-items-center"):
            "Total bill vs tip"
            with ui.popover(title="Add a color variable", placement="top"):
                ICONS["ellipsis"]
                ui.input_radio_buttons(
                    "scatter_color",
                    None,
                    ["none", "sex", "smoker", "day", "time"],
                    inline=True,
                )

        @render_plotly
        def scatterplot():
            color = input.scatter_color()
            return px.scatter(
                tips_data(),
                x="total_bill",
                y="tip",
                color=None if color == "none" else color,
                trendline="lowess",
            )

    with ui.card(full_screen=True):
        with ui.card_header(class_="d-flex justify-content-between align-items-center"):
            "Tip percentages"
            with ui.popover(title="Add a color variable"):
                ICONS["ellipsis"]
                ui.input_radio_buttons(
                    "tip_perc_y",
                    "Split by:",
                    ["sex", "smoker", "day", "time"],
                    selected="day",
                    inline=True,
                )

        @render_plotly
        def tip_perc():
            from ridgeplot import ridgeplot

            dat = tips_data()
            dat["percent"] = dat.tip / dat.total_bill
            yvar = input.tip_perc_y()
            uvals = dat[yvar].unique()

            samples = [[dat.percent[dat[yvar] == val]] for val in uvals]

            plt = ridgeplot(
                samples=samples,
                labels=uvals,
                bandwidth=0.01,
                colorscale="viridis",
                colormode="row-index",
            )

            plt.update_layout(
                legend=dict(
                    orientation="h", yanchor="bottom", y=1.02, xanchor="center", x=0.5
                )
            )

            return plt

# --------------------------------------------------------
# Reactive calculations and effects
# --------------------------------------------------------

@reactive.calc
def tips_data():
    bill = input.total_bill()
    idx1 = tips.total_bill.between(bill[0], bill[1])
    idx2 = tips.time.isin(input.time())
    return tips[idx1 & idx2]


@reactive.effect
@reactive.event(input.reset)
def _():
    ui.update_slider("total_bill", value=bill_rng)
    ui.update_checkbox_group("time", selected=["Lunch", "Dinner"])
Code in app.py relies on two other files. A datafile named tips.csv and a style sheet named styles.css.
Create the data file
Let’s add a blank csv file to a new directory named data.
mkdir data
touch data/tips.csv
Open tips.csv in your project and paste in this raw data.
Create the style file
Now create the new styles file.
touch styles.cssOpen the file and copy and paste the code below.
:root {
    --bslib-sidebar-main-bg: #f8f8f8;
}

  .popover {
    --bs-popover-header-bg: #222;
    --bs-popover-header-color: #fff;
  }

  .popover .btn-close {
    filter: var(--bs-btn-close-white-filter);
  }
Make sure that all your new files are saved.
Test the application
Now you have everything you need to test the application. Run the following code from the terminal.
shiny runYour application should load locally.
Now that everything looks good and we’ve created a file to help reproduce your local environment, it is time to get the code on GitHub.
2. Push to GitHub
Sign in to GitHub and create a new, public repository.
Before syncing your project with the new repository, create a .gitignore file so that you don’t add the virtual environment to the repo.
touch .gitignore
Add the virtual environment folder to the .gitignore file.
venv/
You are now ready to sync the project with your new repo. Run the following lines in the terminal, replacing https://github.com/account-name/repo-name.git with your repository’s link.
git init .
git commit -m "first commit"
git branch -M main
git remote add origin https://github.com/account-name/repo-name.git
git push -u origin main
Finally, refresh your GitHub repository page. You should see everything that was in your local directory with the exception of the virtual environment folder, which was excluded in the .gitignore file.
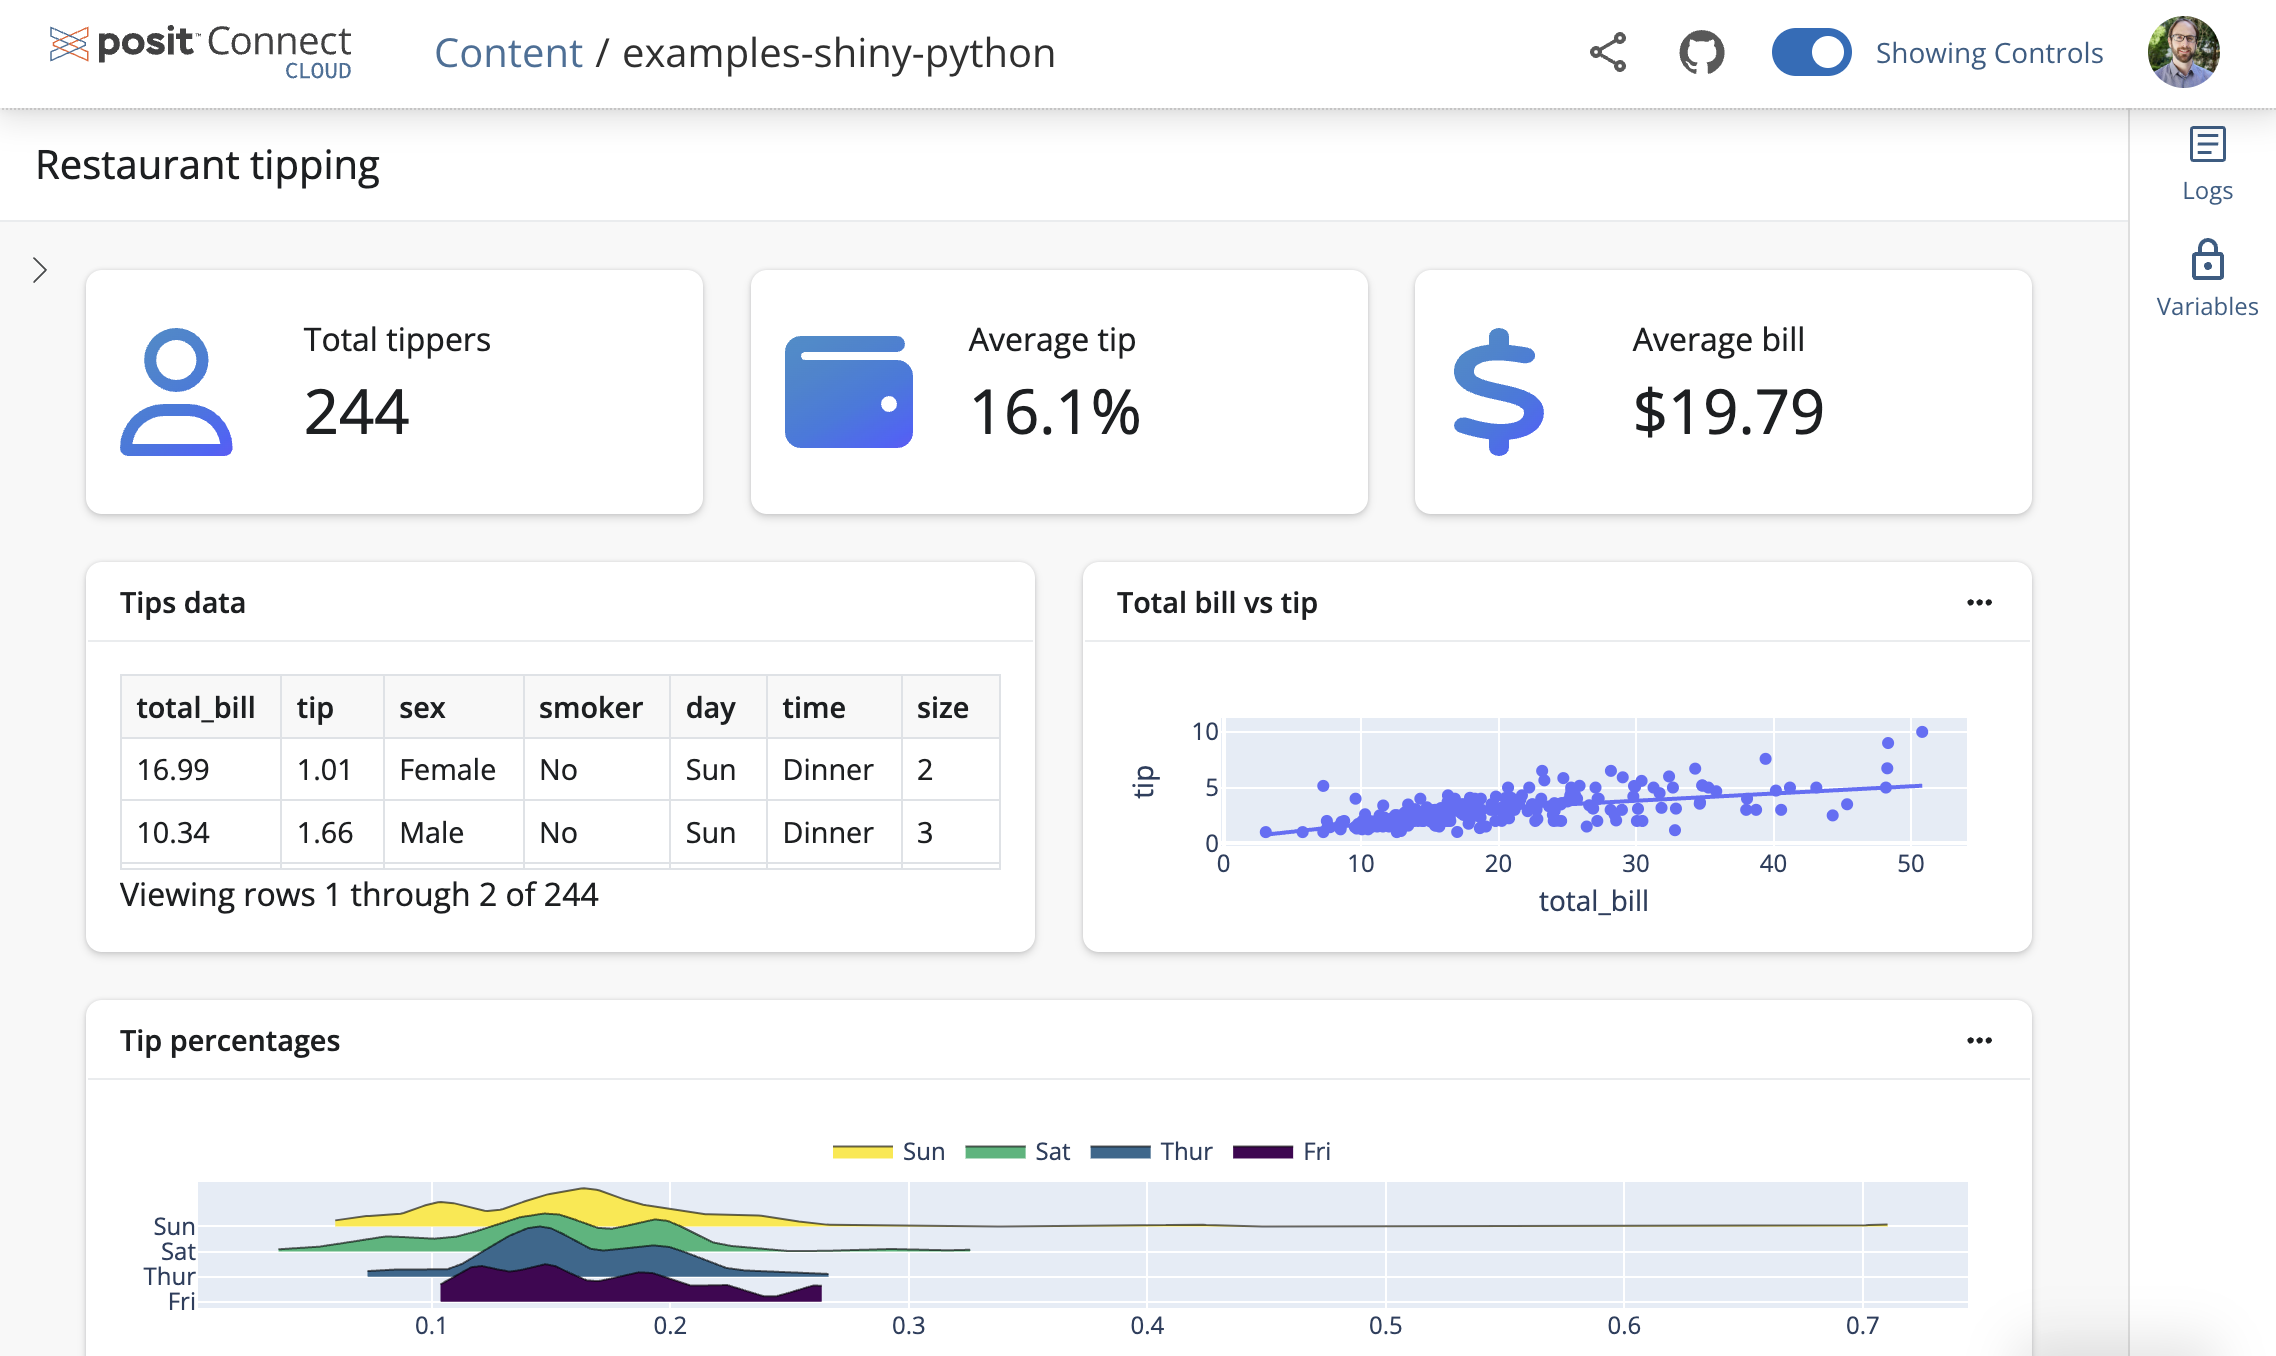
3. Deploy to Posit Connect Cloud
Follow the steps below to deploy your project to Connect Cloud.
Sign in to Connect Cloud.
Click the Publish icon button on the top of your Home page
Select Shiny
Select the public repository that you created in this tutorial
Confirm the branch
Select app.py as the primary file
Click Publish
Publishing will display status updates during the deployment process. You will also find build logs streaming on the lower part of the screen.
Congratulations! You successfully deployed to Connect Cloud and are now able to share the link with others.
4. Republish the application
If you update the code to your application or the underlying data source, commit and push the changes to your GitHub repository.
Once the repository has the updated code, you can republish the application on Connect Cloud by going to your Content List and clicking the republish icon.